Mainland Southeast Asia (MSA), located between China and the South Asian Sub-continent, is a key region for the promotion of the Maritime Silk Road in the Belt & Road Initiative. With a typical tropical monsoon climate, this region has been affected by climate change in recent years, frequently hit by natural disasters such as droughts and floods. Meanwhile, it is very difficult to monitor and study droughts in this region due to the complexity of land cover and topography, the relative lack of measured data and the extremely uneven distribution of observation stations in this region. In order to make up for such disadvantages as the lack of measured data, Associate Professor Lu Hui’s Research Group of the Department of Earth System Science (DESS), Tsinghua University has developed a soil moisture drought Eight Day index (SED) based on remote sensing soil water data, and used this index to systematically assess droughts in Mainland Southeast Asia.
The above research results have been recently published in IEEE Journal of Selected Topics in Applied Earth Observations and Remote Sensing as an article titled Satellite-Based Assessment of Meteorological and Agricultural Drought in Mainland Southeast Asia. This article proposes a drought monitoring index based on remote sensing soil water data, which can break free from the constraint of the traditional drought index, which depends on long-term historical data. With this index, using remote sensing observation data alone, we can carry out large-scale and high-time resolution assessment of soil water drought. The index can guide rapid monitoring of agricultural drought and large-scale assessment of drought disasters.
Firstly, the traditional meteorological drought monitoring method (SPI) and the SED drought monitoring metho are compared in terms of the time series distribution and spatial change of drought areas in the region under study. It is found that both SPI and SED can reflect the periodic changes of drought in the region under study, but SED can reflect the occurrence, development and end of drought more accurately in both time and space. As can be seen from Figure 1 and Figure 2, the drought event in 2016 detected by SPI and SED starts from the middle of the region under study, and gradually develops to the southwest, and finally subsides at the western coast. SED better revealed the migration of the drought center of this drought event, and it maps change rapidly following precipitation triggered by the summer monsoon.
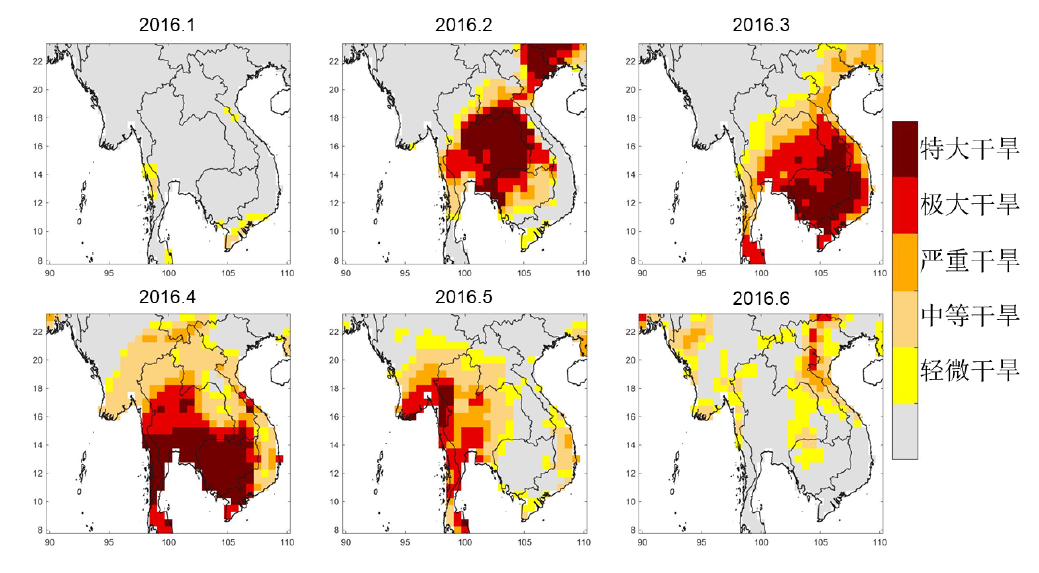
Fig. 1 SPI maps of the 2016 spring drought event
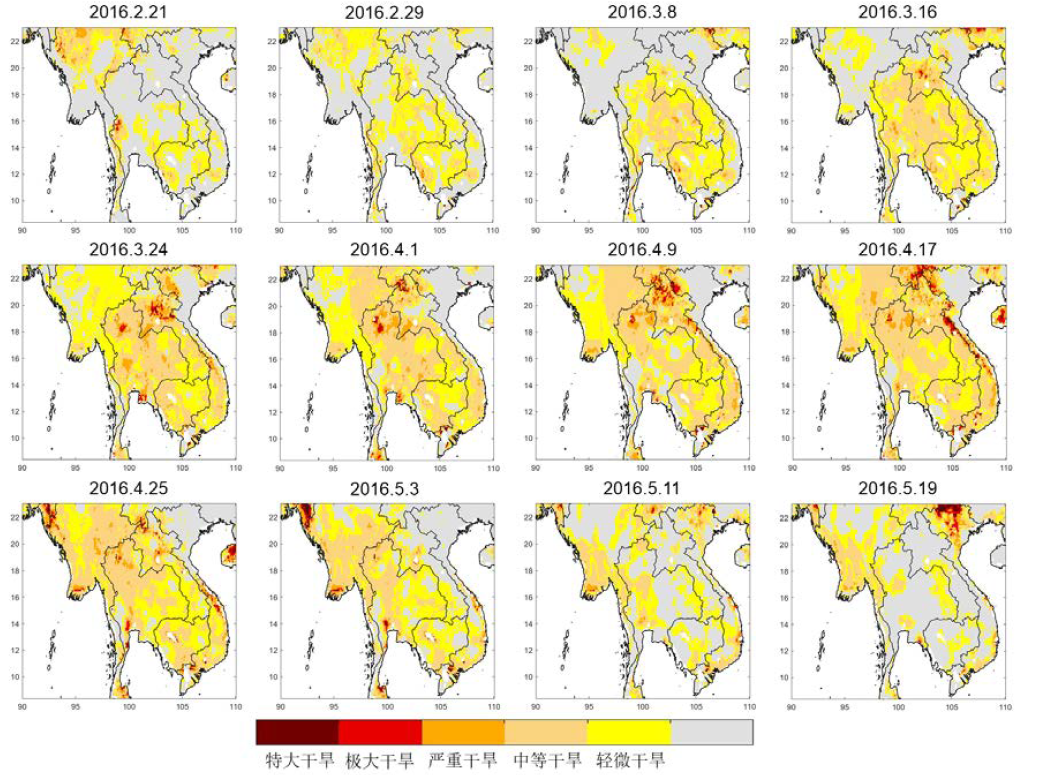
Fig. 2 SED maps of the 2016 spring drought event
The characteristics of the SED index are further analyzed. First of all, SED can reflect the impact of precipitation on drought more effectively than SPI. Fig. 3 shows the time series of SPI, SED and precipitation at three points in the 2016 drought event. It can be concluded that with the gradual aggravation of the drought, SED can better reflect the drought aggravation caused by continuous insufficient precipitation and the rapid fading of drought caused by precipitation. However, it is difficult for SPI to truly reflect the changes of drought caused by precipitation changes because its calculation is based on historical data to reflect the relative degree of drought.
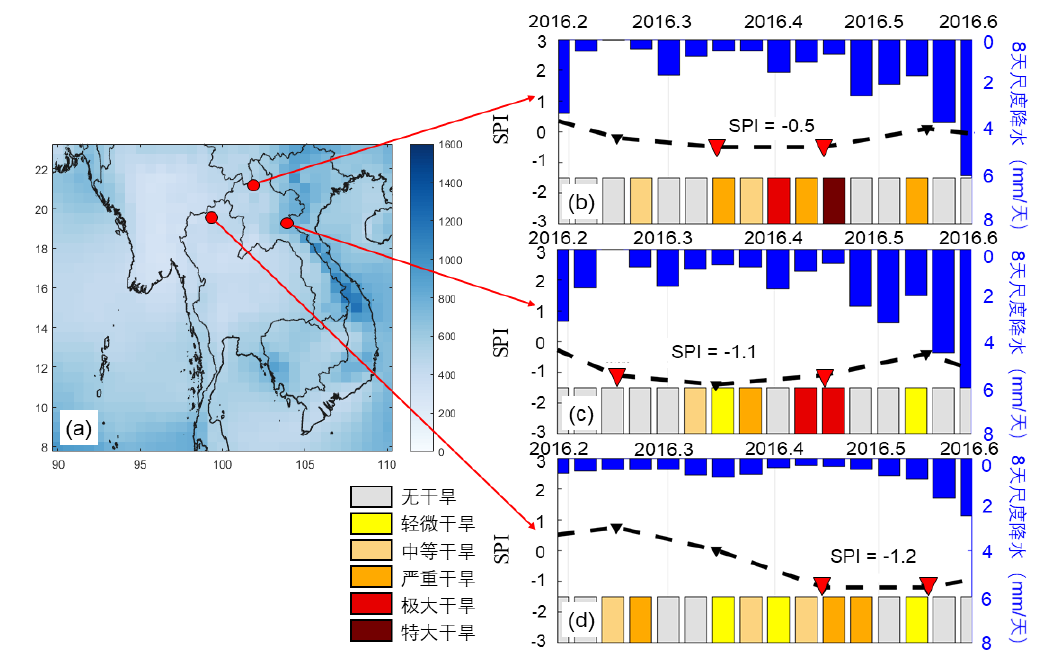
Fig. 3 Case-based comparison results of SPI and SED
Secondly, SED can also reflect the "resistance" of humid areas to drought events. Fig. 4 shows the time series of drought events in two areas divided around Tonle Sap Lake (Located in the west of Cambodia, Tonle Sap Lake is the largest freshwater lake in Southeast Asia, with a developed water system around the lake). It can be seen from SED's drought time series diagram that in time of drought, the occurrence of a drought event around Tonle Sap Lake (red area in Figs 4(a)) lags behind other areas in western Cambodia (blue area in Fig. 4(a)). Thus the SED index can truthfully reflect the “resistance” of the lake and the moisture holding capacity of the surrounding water system to drought events.
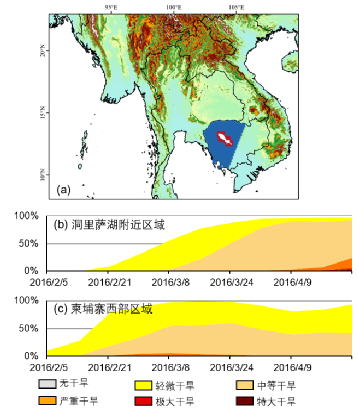
Fig. 4 SED quantitatively reflects the “resistance” of humid areas to drought
With the above characteristics, SED can reliably and quickly monitor drought events, reflect the real drought situation based on the change of soil moisture, and support researchers and policy makers to conduct large-scale and high-precision drought assessment in areas lacking measured data, which is of great significance to the scientific research of extreme drought events, drought resistance and disaster reduction in the future scenarios of climate change.
Li Yishan, a Ph.D. graduate of the DESS, Tsinghua University, is the first author of this paper, and Associate Professor Lu Hui of the DESS is the corresponding author of this paper. Other co-authors are from Tsinghua University, MIT, the Chongqing Ecological Environment Bureau, the Yangtze River Survey, Planning and Design Institute and other institutions. This research is supported by the National Key Research and Development Plan (2017YFA0603703) and the Second Tibetan Plateau Scientific Expedition and Research Project (2019QZKK0206).
Full-text link: https://ieeexplore.ieee.org/document/9829261


 Picture News
 Hot News