Aridity Index (AI), as an index to measure the degree of dryness and wetness in a region, is also one of the climate indexes often involved in the study of global change. In the traditional calculation, AI refers to the ratio of annual average precipitation to net radiation, but this calculation method fails to fully consider the spatial differences of land surface (such as soil texture and topography). To better reflect this influence, Lu Hui's Research Group found that the evapotranspiration-soil water coupling regime (EF regime) described by remote sensing data with high spatial-temporal resolution can make up for this deficiency. Using the long-time scale daily surface soil moisture dataset developed by the research group independently and the evapotranspiration method estimated based on the surface flux balance theory, the coupling intensity of evapotranspiration and soil water (∆Corr ) in China and the United States was analyzed, and a new regionalization of surface aridity was put forward.
A/Prof. Lu Hui's Research Group of the Department of Earth System Science (DESS), Tsinghua University has recently published a paper titled “A Simple Framework to Characterize Land Aridity Based on Energy Partitioning Regimes” in Environmental Research Letters, which, based on remote sensing datasets and the EF regimes, proposes a surface aridity classification scheme considering surface energy and water distribution process. This scheme, considering the spatial heterogeneity of land surfaces, expands the spatial and tempera variations of aridity classification, provides guidance for studying regional climate changes and human production activities and formulating relevant regional measures for disaster reduction and prevention.
Firstly, the spatial distribution maps of traditional AI and the EF regimes are compared. From Fig. 1, AI and the EF regimes are similar in the overall spatial distribution pattern. This means that the EF regimes and AI can reflect the same surface energy and water balance information, that is, the long-term mean total amount information. However, there are obvious differences in local characteristics between them. For example, in Yunnan, China and some areas in the southern United States, when the surface water represented by AI is relatively humid, the EF regimes show the opposite result. This indicates that the information reflected by the two is different. The attribution analysis of eight sample pairs shows that using the EF regimes can better reflect the influence of spatial heterogeneity of underlying surface (Fig. 2).
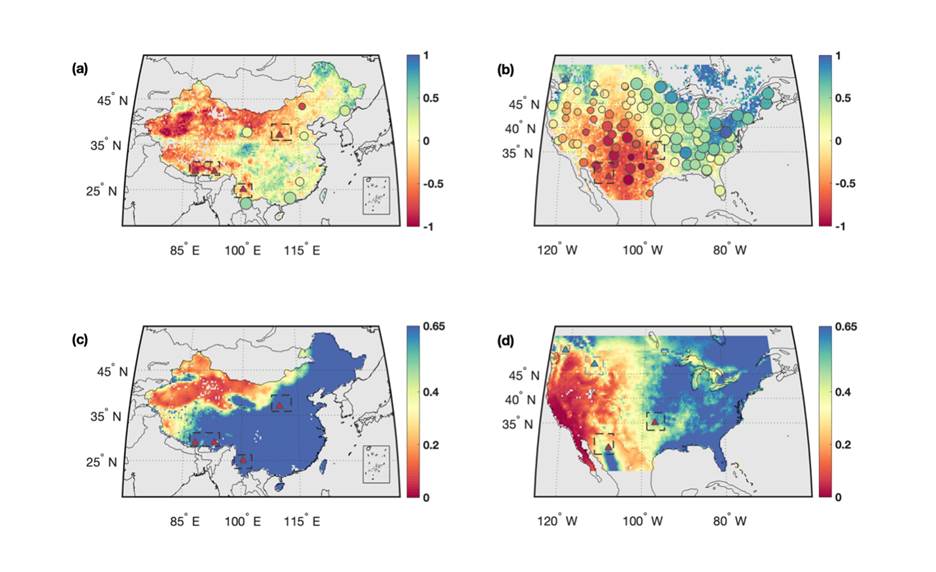
Fig. 1 Evapotranspiration-soil water coupling strength (a-b; ∆Corr>0 indicates that evapotranspiration is energy-limited, and otherwise it is water-limited. At the same time, the greater the absolute value of ∆Corr, the higher the coupling strength of evapotranspiration-soil water) and the spatial distribution of aridity index AI(c-d) in the two regions under study. The letters in the map are the labels of the samples selected for analysis in the study.
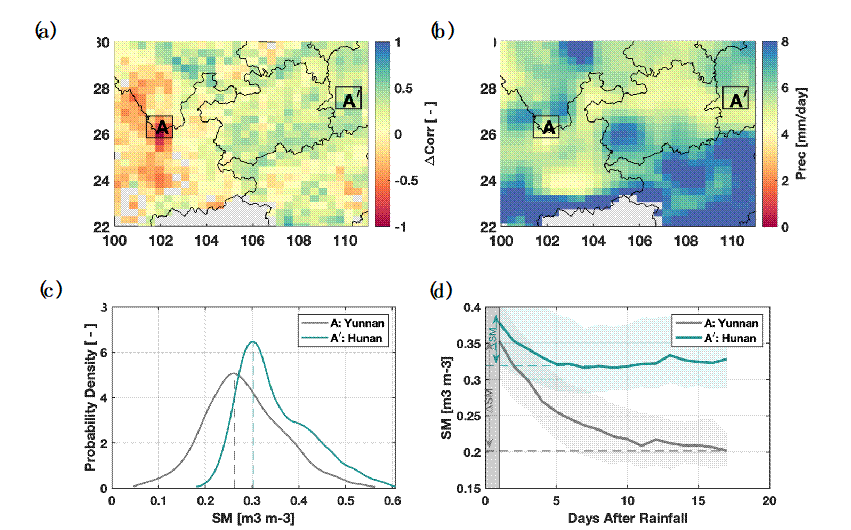
Fig. 2 The evapotranspiration-soil-water coupling intensity (a) and AI spatial distribution diagram (b) of sample A in Yunnan, China and sample A' in Hunan, China, and the schematic diagrams of soil water probability density curve (c) and soil water regression curve (d) of them. Sample A and sample A' have similar precipitation, but show opposite evapotranspiration regimes. This may result from the many karst landforms on the Yunnan-Guizhou Plateau where sample A is located, which cause the precipitation reaching the surface to seep into the deep soil at a faster rate, leading to relatively dry surface soil moisture content.
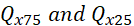
Based on the above analysis, the study proposes the use of EF regimes in a two-tiered surface aridity classification scheme (Fig. 3). The first tier reflects the same information as AI, that is, the conditions of surface wetness (W) and dryness (D) determined by the energy/water-limited mechanism of evapotranspiration. At the same time, because the different information reflected by ∆Corr and AI is caused by the spatial heterogeneity of the underlying surface and the interaction between land and atmosphere, it means that the classification of evapotranspiration-soil water coupling strength can indicate extreme weather and climate events. Therefore, in the second tier, when the coupling strength is greater than 75 percentile, it means that the risk of extreme weather and climate events in this area is higher (h), while it is lower (l) when it is lower than 25 percentile.
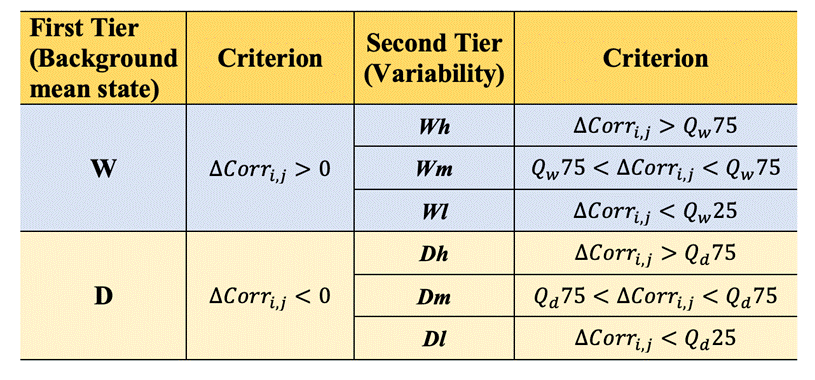
Fig. 3 Aridity classification scheme based on the EF regimes. W indicates wet climate (long-term mean), and D indicates dry climate.
 represent evapotranspiration-soil water effect intensity on ∆Corr thresholds (75and 25 percentiles), and
 represent grid line numbers.
Fig. 4 presents the aridity classification maps by using AI and the EF regimes, which indicate that compared with AI-based classification, the new index has better indication signficance for regions where extreme weather events occur often (such as southern U.S. and Yunnan, China).
Compared with the traditional aridity index (AI), the regionalization framework based on the evapotranspiration and soil water coupling mechanism proposed herein can better reflect the surface energy and water budget caused by the spatial heterogeneity of the underlying surface and land-atmosphere interaction. Moreover, aridity defined at relatively short time scales (i.e. daily) is more reflective of the extreme conditions (rapid drought stress and heatwaves) induced by strong land–atmosphere coupling, since these events often occur within a relatively short time period. Hence our redefined aridity map should be viewed as providing complementary information to AI to include short-term surface water and energy variabilities, as reflected in EF regimes, to be considered along with the background climate for addressing environmental challenges related to water, ecosystems, and extreme events.
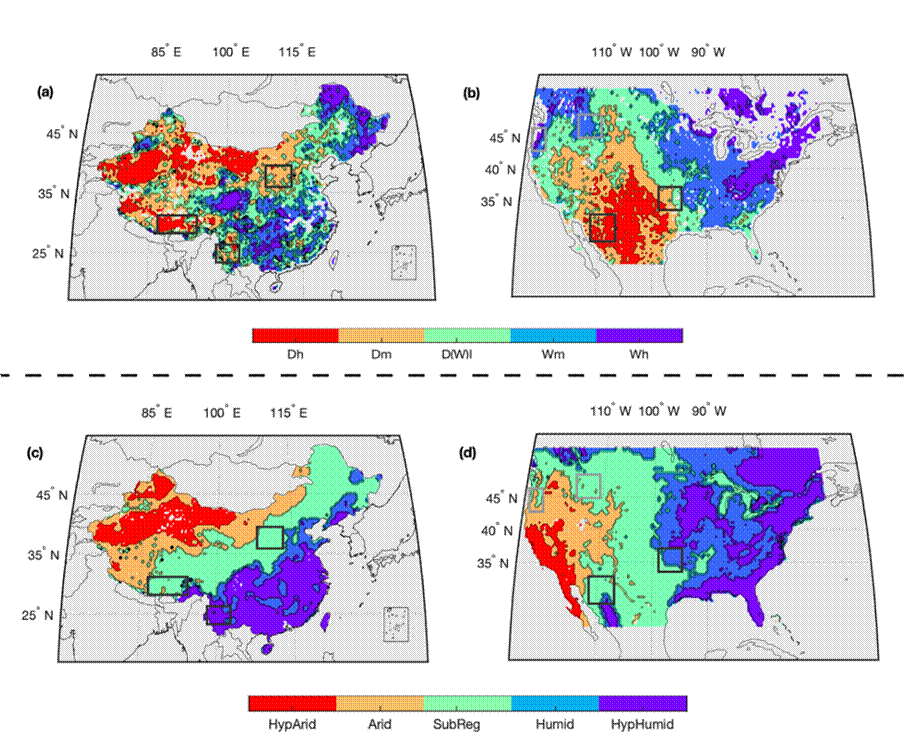
Fig. 4 Regionalization of surface aridity based on (a), (b) EF regimes and (c), (d) AI. Black and gray frames in the maps represent the positions where analysis samples are located.
He Qing, a doctoral student of DESS, Tsinghua University, is the first author of this paper, and Associate Professor Lu Hui of DESS, Tsinghua is the corresponding author of this paper. The collaborators include Professor Yang Kun of DESS, Tsinghua University, Academician L. Ruby Leung of Pacific Northwest National Laboratory, Professor Pan Ming of the University of California, San Diego, Dr. He Jie of the Institute of Qinghai-Tibet Plateau, the Chinese Academy of Sciences, and Yao Panpan, assistant researcher of the Aerospace Information Research Institute, Chinese Academy of Sciences. This research is supported by the National Key Research and Development Program (2017YFA0603703) and the Second Qinghai-Tibet Plateau Scientific Research Project (2019QZKK0206).
Full-text link:
He, Q., Lu, H.*, Yang, K., Leung, L.R., Pan, M., He, J., Yao, P., 2022. A simple framework to characterize land aridity based on surface energy partitioning regimes. Environ. Res. Lett. 17, 034008.
https://doi.org/10.1088/1748-9326/ac50d4
Written by He Qing
Edited by Wang Jiayin
Reviewed by Zhang Qiang and Lu Hui


 Picture News
 Hot News