Distinguished Professor Dabo Guan at Department of Earth System Science, Tsinghua University published his new study “Structural decline in China’s CO2emissions through transitions in industry and energy systems” in Nature Geoscience on 2 July 2018. This study analyzes the trend of China’s CO2emissions between 2000 and 2016 using the latest availableenergy, economic and industry data, and quantitatively evaluates the drivers of change in China’sCO2emissions between 2007 and 2016 using the Index Decomposition Analysis. This study concludes that the decline in emissions from 2013 to 2016 was largely associated with changes in industrial structure and a decline in the share of coal in energy mix. China has been the largest contributor to global CO2emissions since 2005 and its emission trend profoundly affects the attainment of the ‘Paris goal’. The results provide solid evidences and new clues for China’s emission reduction in the coming age.
This study is based upon the emission inventories developed by China Emission Accounts and Datasets (CEADs), an open and transparent database led by Professor Dabo Guan. The estimated emissions cover the energy use for agriculture, industry, service and residential household and are subdivide into 17 types of fuels, 7 industrial processes and 46 socioeconomic sectors. Three level of inventories- national, provincial and city- are developed in consistent and comparable manners. All the emission data are open source and free to download for academic use.
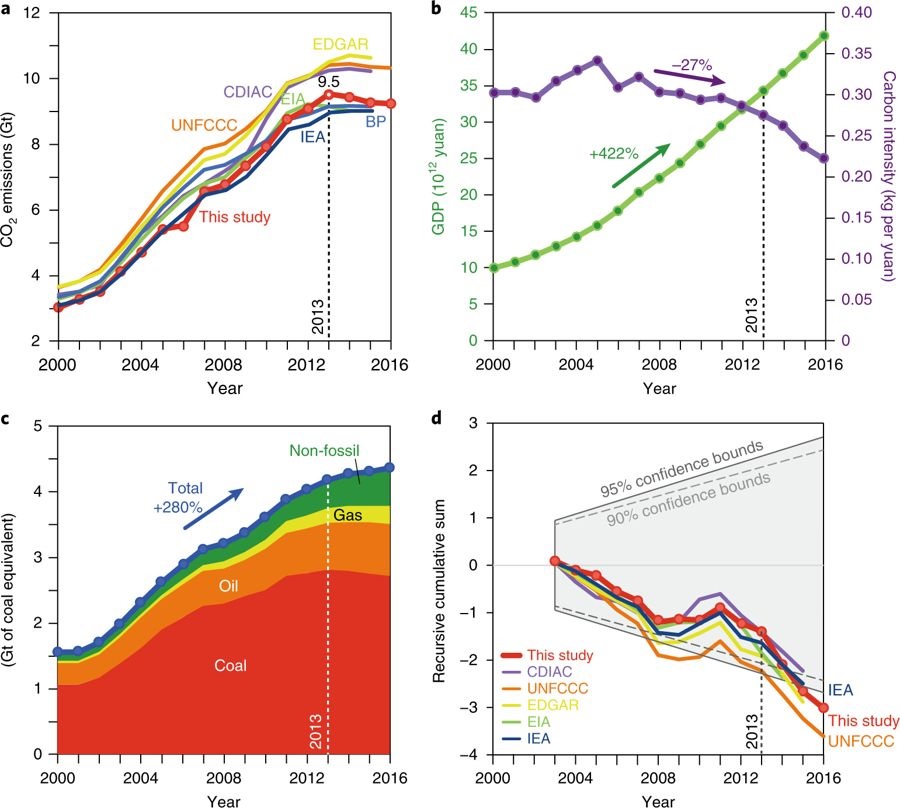
This study reveals that China’s emissions grew at an average annual rate of 9.3% between 2000 and 2013, from ~3.0 Gt in 2000 to 9.5 Gt CO2in 2013. Emissions then declined by 1.0%, 1.8% and 0.4% in 2014, 2015 and 2016, respectively, reaching 9.2 Gt CO2in 2016.Between 2007 and 2013, the increase in Chinese emissions was dominated by strong economic growth, and slightly offset by energy efficiency gains. In contrast, the decline in China’s emissions from 2013 to 2016 was a results ofindustrial structure changes, drop of coal in energy mix and the decreasing energy intensity.Chinese economic growth in 2013–2016 was somewhat slower than the previous periods, which also enhanced the trend.China’s emissions may fluctuate in the coming years whichmeans that 2013 may not be the last peak. However, the changes in industrial activities, coal use andefficiency leading to the recent decline have roots in the changingstructure of China’s economy and long-term government policies.Both emissions and their underlying driverswill need to be carefully monitored, but the fact that China’s emissionshave decreased for several years—and more importantly the reasonswhy—give hope for further decreases going forward.

Temporal change of CO2emissions and related indicators in China from 2000 to 2016.
The first and corresponding author is Distinguished Professor Dabo Guan atDepartment ofEarth System Science, Tsinghua University. The co-authors include Dr.Jing Meng and Dr. David M. Reiner at Cambridge University, Dr. Zhifu Mi at University College London, Dr. Yuli Shan at University of East Anglia, Professor Qiang Zhang and Dr. Zhu Liu at Tsinghua University, Dr. Steven J. Davis at the University of California, Irvine, Professor Ning Zhang at Jinan University, and Professor Shuai Shao at Shanghai University of Finance and Economics. This work was supported by the National Natural Science Foundation, the National Key R&D Program of China, the National Social Science Fund, and Chinese Academy of Engineering.
Article link:https://www.nature.com/articles/s41561-018-0161-1