Cropland is a foundation for human survival and development. Accurate, detailed, and up-to-date information on cropland extent is crucial for accurate agricultural layout, and the assessment of food security. However, due to the lack of accuracy, robustness and transferability in traditional cropland mapping methods, it remains challenging to monitor cropland dynamics at high spatial and temporal resolutions across large geographical extents, which in turn challenges the scientific agricultural decision making and the realization of sustainable development.
With regard to the above inadequacies and challenges, Xu Bing’s Research Group of the Department of Earth System Science (DESS), Tsinghua University has proposed a set of annual cropland mapping framework integrating time series remote sensing images, automatic generation of training samples, machine learning and change detection technologies (Figure 1). Based on the proposed framework, we produced and released the annual cropland dataset of China’s Annual Cropland Dataset (CACD) for 1986–2021 at a 30 m spatial resolution.
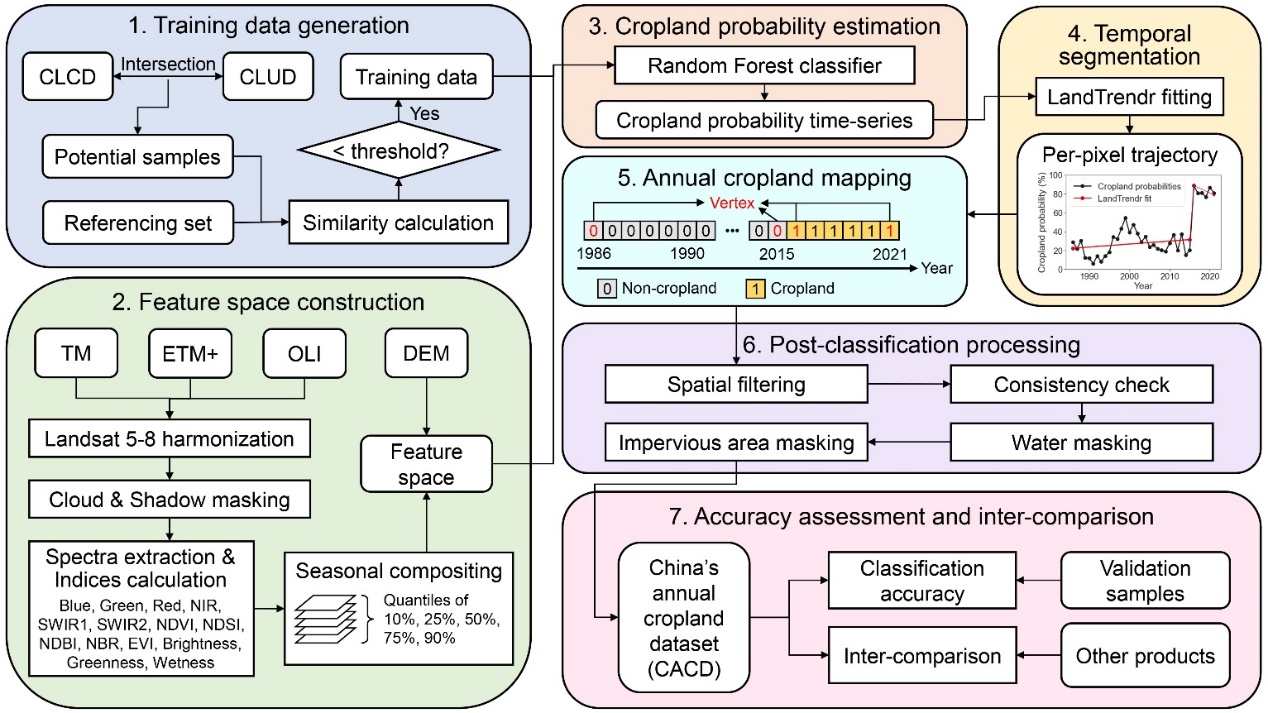
Figure 1 Flowchart of this study for mapping annual cropland dynamics.
The accuracy verification results show that the average overall accuracy of CACD is 0.93±0.01, and the accuracy of changing layers is 0.84. Further, through cross-product comparative analysis, it is found that CACD is superior to other similar data products in mapping accuracy (Figure 2), correlation with statistical data (Figure 3) and spatial details (Figure 4).
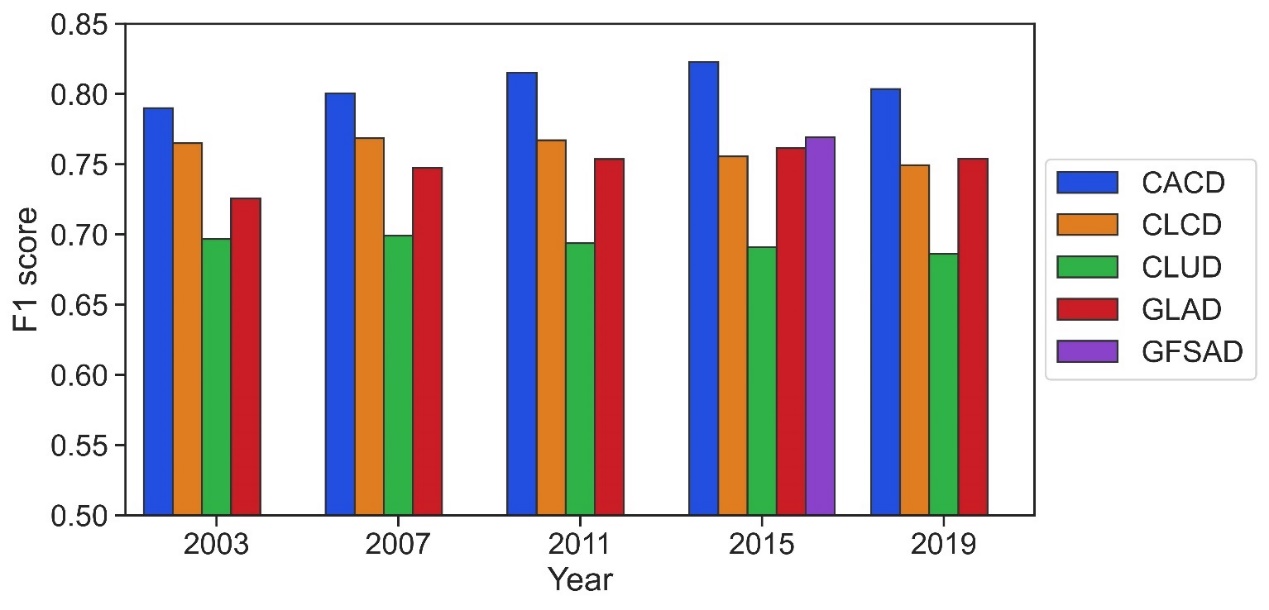
Figure 2 Comparisons of F1 score between the five cropland products (CACD, CLCD, CLUD, GLAD and GFSAD).
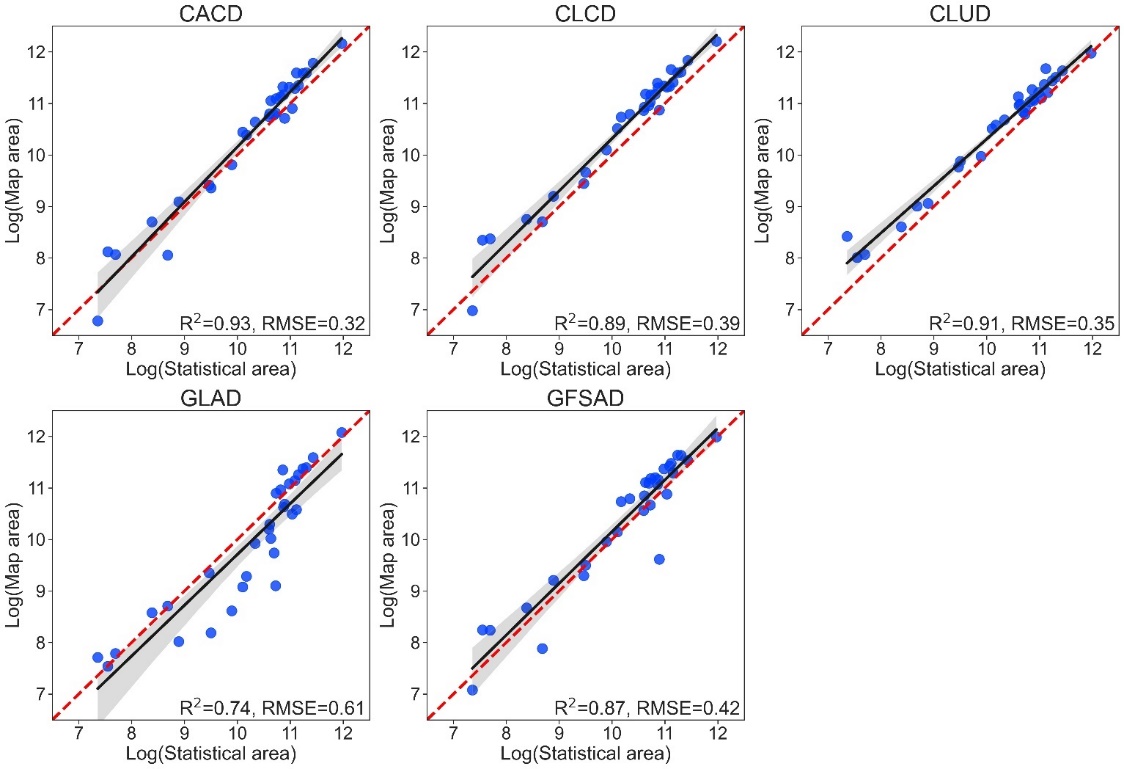
Figure 3 Scatterplots of the provincial cropland area in 2015 between the five products (CACD, CLCD, CLUD, GLAD and GFSAD). and the statistical data. The dashed red line represents the 1:1 diagonal.
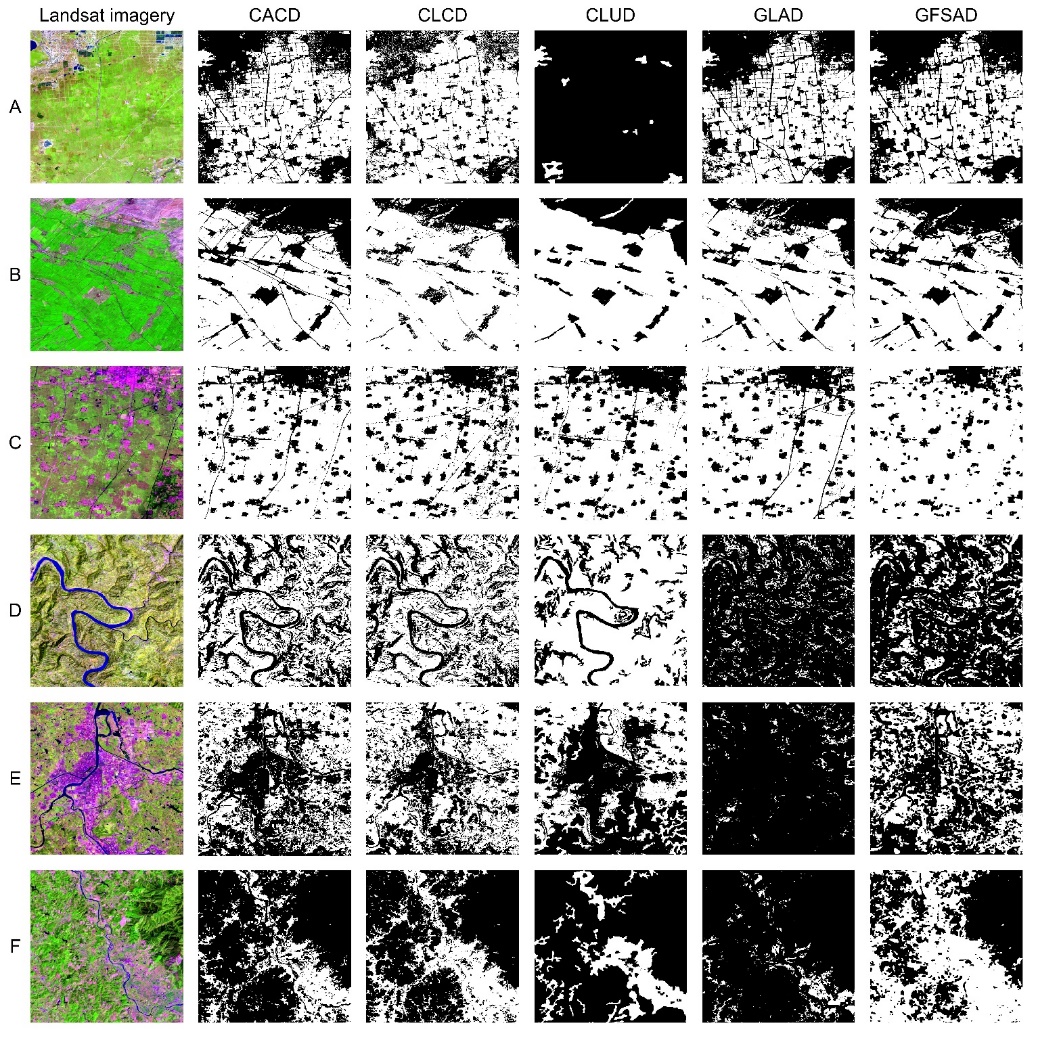
Figure 4 Regional comparisons of the five products (CACD, CLCD, CLUD, GLAD and GFSAD) in 2015. Referencing Landsat imagery in the first column is composited by SWIR-1, near-infrared, and red bands in RGB channels. Columns two to six display the spatial distribution of the five products, with cropland shown in white and non-cropland shown in black.
According to the research, China's total cropland area grew from 1 707 400 ± 204 000 km2 in 1986 to 1 720 300 ± 211 500 km2 in 2021, a net increase of 30 300 km2 (1.79 %). Cropland expansion was concentrated in the northwest and the northeast (such as Xinjiang, Inner Mongolia and Heilongjiang) while the eastern, central, and southern regions experienced substantial cropland loss (such as Jiangsu, Inner Mongolia and Heilongjiang). In addition, the total area of cropland took the trend of “first increasing, then decreasing and then slowly increasing”: Cropland area increased before 2022, kept decreasing from 2002 to 2015, and then increased again in 2015 (Figure 5b).
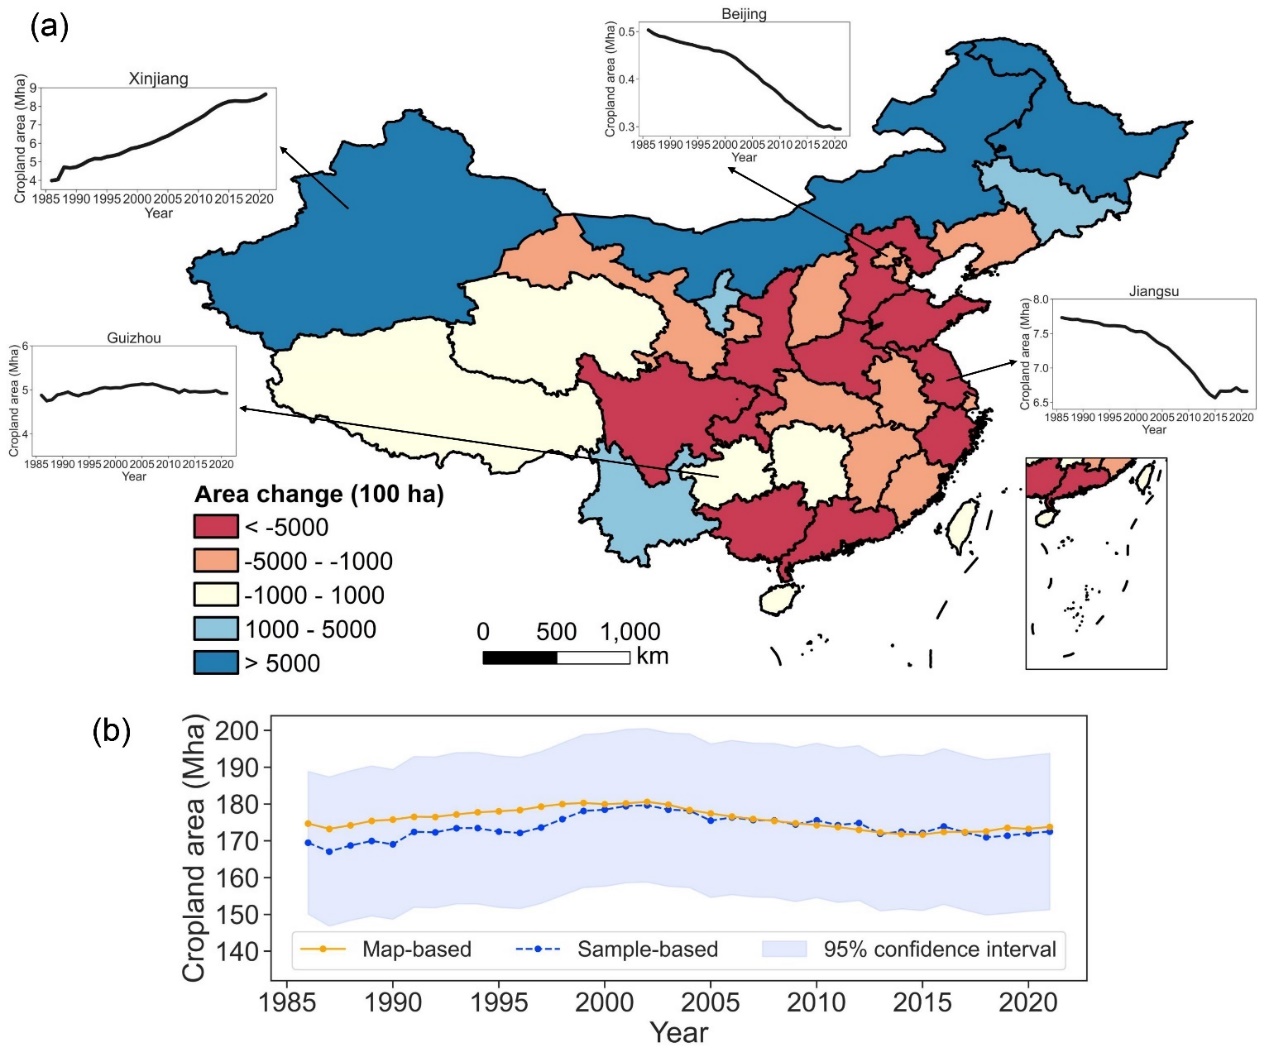
Figure 5 Cropland area changes in China between 1986 and 2021. (a) Provincial cropland change; (b) Time change trends.
In addition, a comprehensive analysis of cropland abandonment in China was conducted, revealing that about 420 000 km2 (17.57 %) of the croplands in China were abandoned from 1990 to 2015. Most abandoned croplands have been distributed on the Loess Plateau, over Northeast China and Southwest China, with the average altitude being 860m (Figure 6a,b). Temporally, the annual cropland abandonment area in China showed an upward trend from 1990 to 2015, i.e., it increased from 7516 to 14 823 km2 (Fig. 6c).
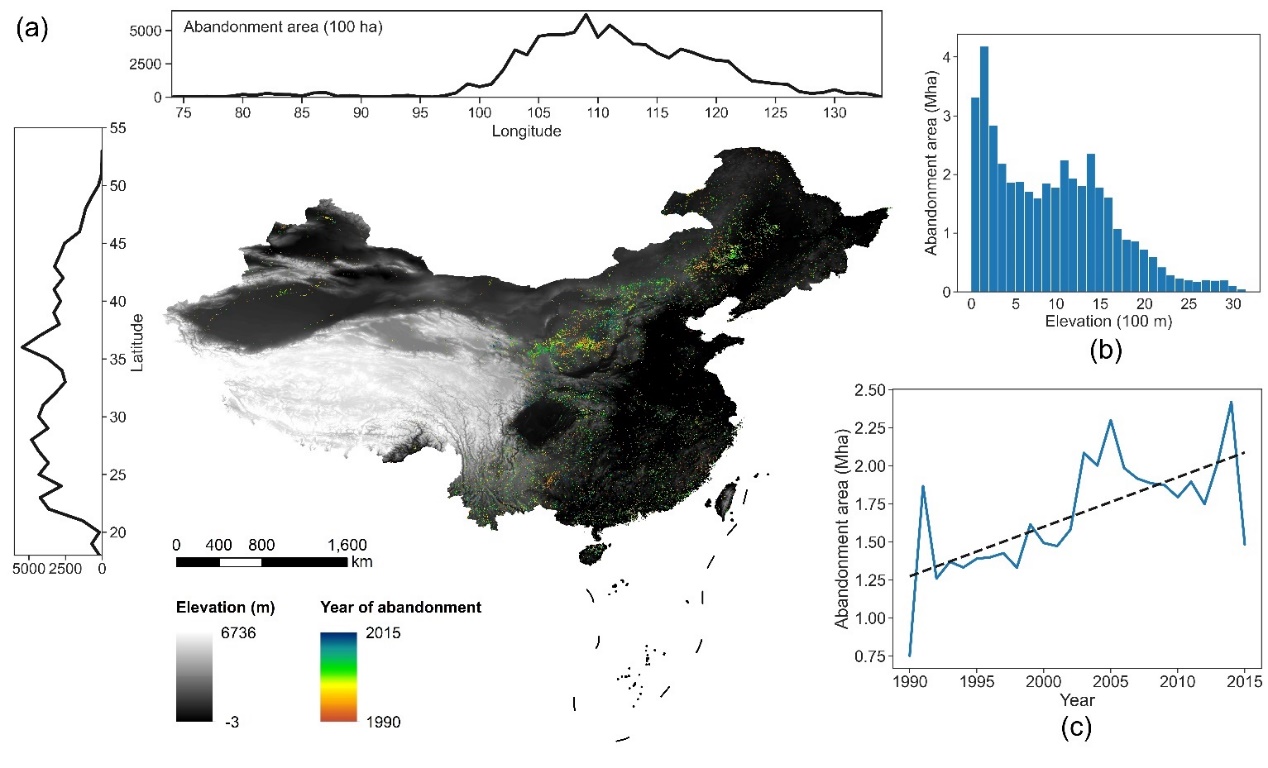
Figure 6 Cropland abandonment in China between 1990 and 2015. (a) Spatial distribution of abandonment time. (b) Histogram distribution within different elevation ranges. (c) Annual trends of abandonment area.
The method framework of this study can be extended to other land types or specific areas for mapping, and the data results of this study can be applied to the research of agricultural monitoring, food security, climate change, biodiversity and other fields.
The related results have been published in the form of a paper titled “A 30 m annual cropland dataset of China from 1986 to 2021” in Earth System Science Data, an international academic journal.
Tu Ying, doctoral graduate of the DESS, Tsinghua University is the first author of the paper, and Professor Xu Bing of the DESS is the corresponding author. Other co-authors include Research Assistant Professor Wu Shengbiao and Assistant Professor Chen Bin of the University of Hong Kong, Professor Weng Qihao of the Hong Kong Polytechnic University, and Professor Bai Yuqi, Professor Yang Jun, and Associate Professor Yu Li of the DESS. This study was supported by the Open Research Program of the International Research Center of Big Data for Sustainable Development Goals (grant no. CBAS2022ORP02), National Natural Science Foundation of China (grant no. 42090015), National Key Research and Development Program of China (grant nos. 2022YFE0209300 and 2022YFB3903703), Science and Technology Commission of Shanghai Municipality (grant no. 22dz1209602), and the University of Hong Kong Faculty of Business and Economics and Shenzhen Research Institutes (grant no. SZRI2023-CRF-04).
Full-text link:
https://essd.copernicus.org/articles/16/2297/2024/
CACD data link:
https://zenodo.org/records/7936885


 Picture News
 Hot News