Urban growth models (UGMs) are the primary tool for generating urban growth projections. Various UGMs based on different modeling frameworks and core algorithms have been made available since the 1950s. However, comparative study of the performance of different models is relatively inadequate. Researchers lack reference basis in choosing a model and the UAM in their research on the projection of urban expansion is often chosen at their discretion, thus increasing the uncertainty of projection results. With regard to the above problems, Prof. Yang Jun’s Research Group of the Department of Earth System Science (DESS), Tsinghua University counts various urban growth models used between 2000 and 2021, from which they select six widely used UGMs, verify them from user perspective, assess the data requirements and flexibility differences of the models, and their performance differences in projecting urban expansion.
Available UGM comparative studies mainly fall into two categories: the first category compares the models and projection results used by different researchers. This method can assess more UGM research cases, but the comparability of the model results is poor because of the different research objects and input data of each case. The second category carries out the same simulation and projection task for different UGMs, and compares the differences of their results and accuracy. This type of method can exclude the input data and other factors, thus revealing the difference of projection results caused by the model itself. However, this kind of research currently has insufficient basis for the selection of UGMs, with little attention paid to the structure, data requirements, flexibility and verification of the models.
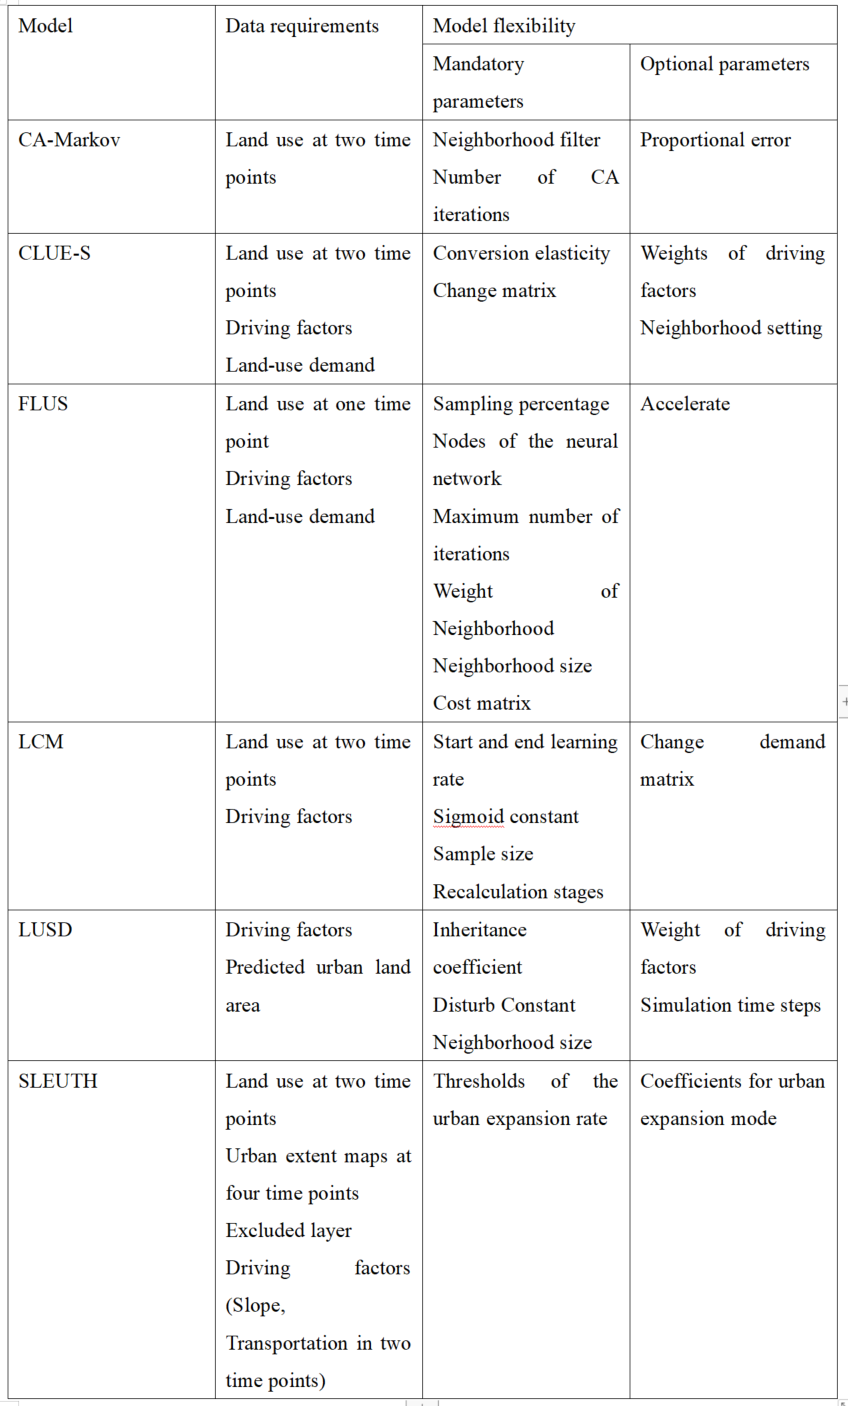
With respect to the above problems, Professor Yang Jun's Research Group first reviewed the use of various UGMs in publications from 2000 to 2021 (Fig. 1). On this basis, the Research Group made a detailed comparison of the input data and the number of optional parameters of six most commonly used UGMs with detailed instruction manuals (Table 1). The Research Group then further simulated and predicted the urban expansion from 2015 to 2020 by using the same resolution and type of input data for the six UGMs, and verified the projection results and integration results of each model by using the three-diagram method.
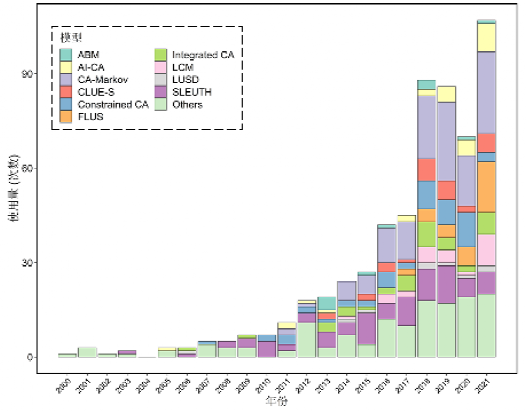
Fig. 1. Usage counts of the top ten urban growth models and others between 2000 and 2021.
Table 1 Data requirements and flexibility of the six models.
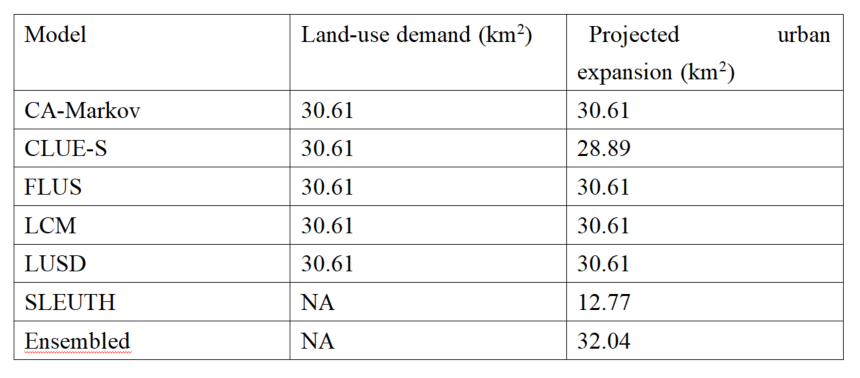
The comparative test takes Shenzhen as the research object, with simulated and real land use changes as the input of land demand, land use data, natural environment data and socio-economic data from 2000 to 2005 as the training set, data from 2005 to 2015 as the model correction, and data from 2015 to 2020 as the verification set. The results show that CA-Markov, FLUS, LCM and LUSD models can produce the urban expansion area specified by users when the real urban area of the target year is put out, while the CLUE-S model has a large number of differences, and the SLEUTH model cannot be used to simulate the pre-determined urban growth scenario (Table 2). However, the spatial distribution of urban expansion projected by each model varies significantly, all different from the real urban expansion spatial situation (Fig. 2). The results of the comparison test of the three diagrams show that the sources of these differences are also different (Table 3).
Table 2 Projected urban expansion between 2015 and 2020, with actual land-use demand
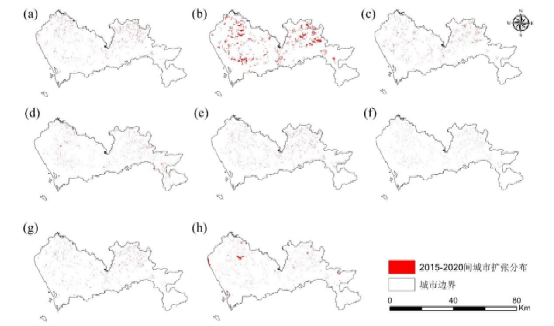
Urban growth during 2015-2020
City boundary
Fig. 2. Urban expansion from 2015 to 2020 predicted by using the extrapolated land-use demand: (a) CA-Markov; (b) CLUE-S; (c) FLUS; (d) LCM; (e) LUSD; (f) SLEUTH; (g) Ensembled method; (h) actual urban gains extracted out from the validation intervals.
Table 3 Model validation results with actual land use area as the input.
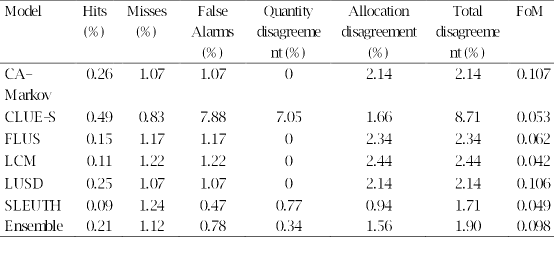
The research findings are as follows: (1) Validation accuracies of the models varied with the inputted data, indicating a model does not have an intrinsic accuracy. Model verification, instead of the accuracy of a single projection, should be a focal concern for potential users to consider when selecting UGMs. (2) After comparing the input data requirements and flexibility of each UGM, it is found that SLEUTH has the highest requirement on input data, while FLUS and LCM allow users to have higher flexibility in modeling. (3) After comparing the projection results with the model expressions given in the model documents, it is found that the CA-Markov, FLUS, LUSD and LCM models have passed the model verification, and the model users can control these models to make projection in different scenarios. This study's findings can help users decide which of the urban growth models suits them.
The research results have been published as a paper titled “A user-friendly assessment of six commonly used urban growth models” in Computers, Environment and Urban Systems。Doctoral candidate Zhang Yuzhi of the DESS, Tsinghua University is the first author of the paper, and Professor Yang Jun is the corresponding author. Professor Mei-Po Kwan of the Chinese University of Hong Kong is a co-author. This study is supported by the Tsinghua-Toyota Joint Research fund “Integrated Demonstration of Key Technologies for Interdisciplinary Research on Future Cities” and funding from the National Key Research and Development Program of China (Grant No. 2019YFA0607201).
Paper information: Zhang, Y., Kwan, M. P., & Yang, J. (2023). A user-friendly of six commonly used urban growth models. Computers, Environment and Urban Systems, 104, 102004.
Full-text link of the paper: https://www.sciencedirect.com/science/article/pii/S0198971523000674
Written by Zhang Yuzhi
Reviewed by Yang Jun and Zhang Qiang


 Picture News
 Hot News